More than a platform and more than a community — GitHub is a collective consciousness of code, a record of innovation shaped and reshaped by every software developer in the world.
We were tasked with building immersive, real-time data visualizations using Github’s vast repository of activity, expressed as live generative visuals in an informational and dynamic dashboard that was to be displayed in their headquarters.
THE EXPERIENCE
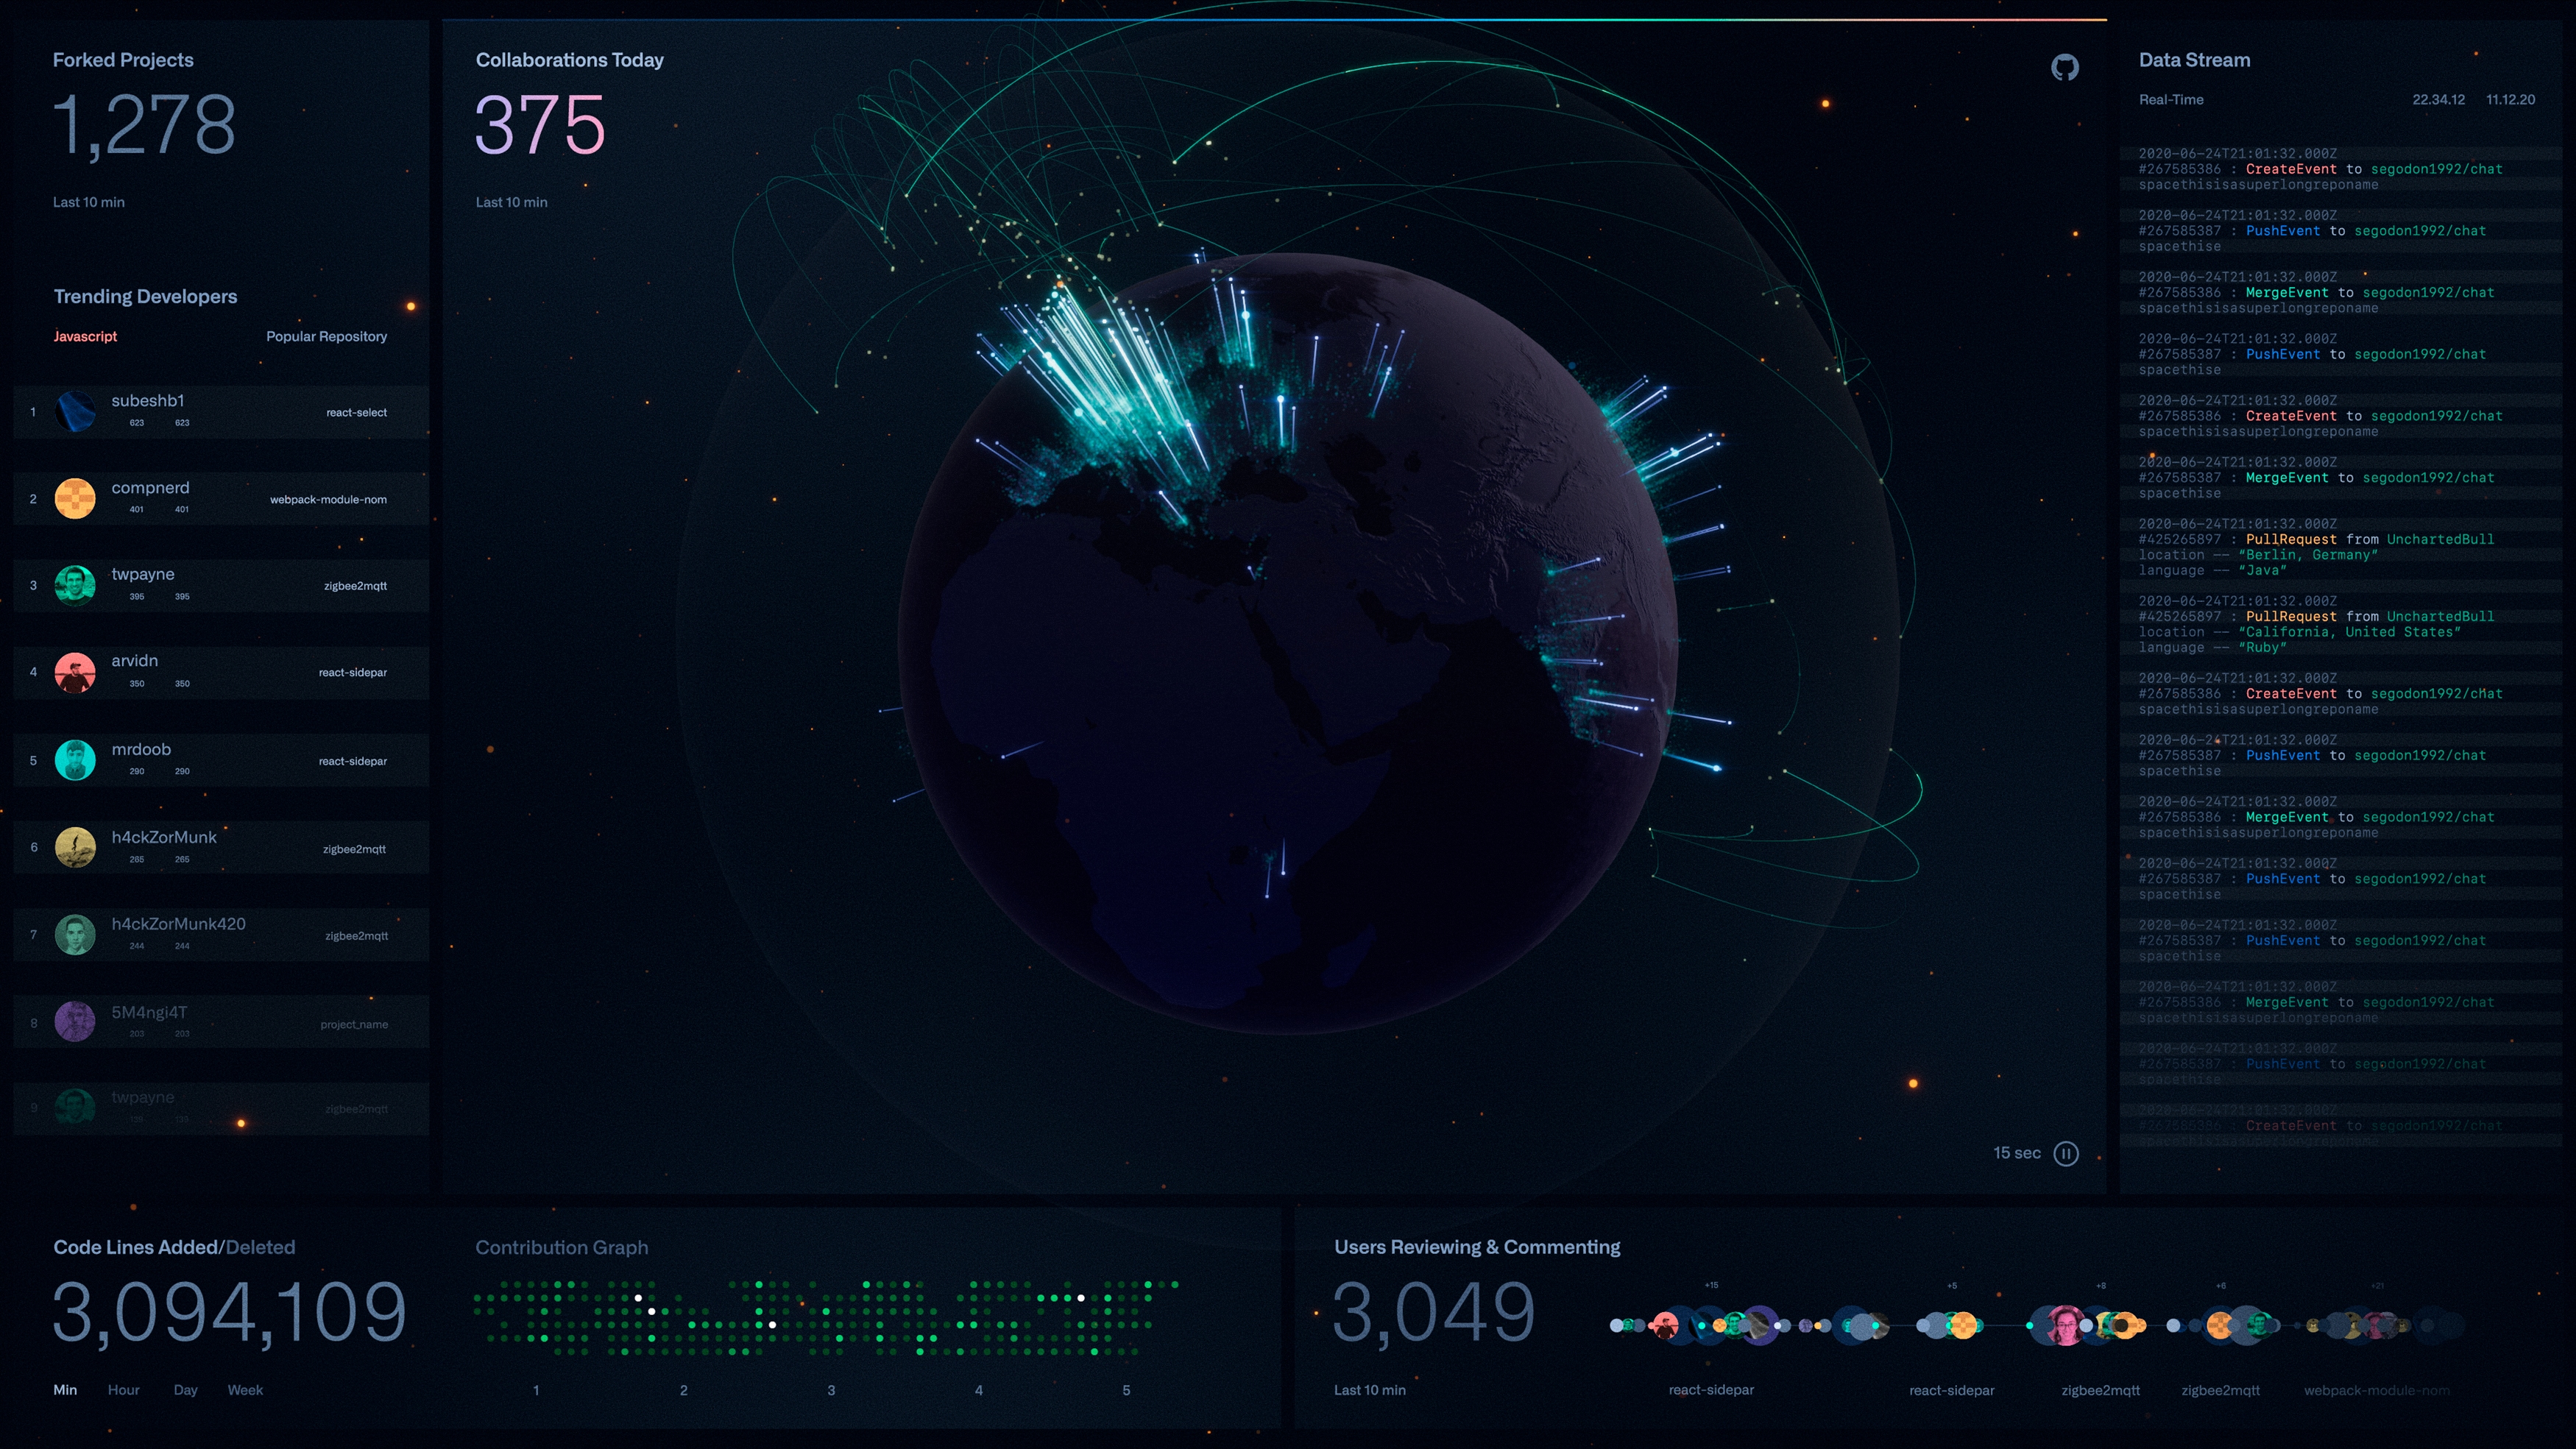
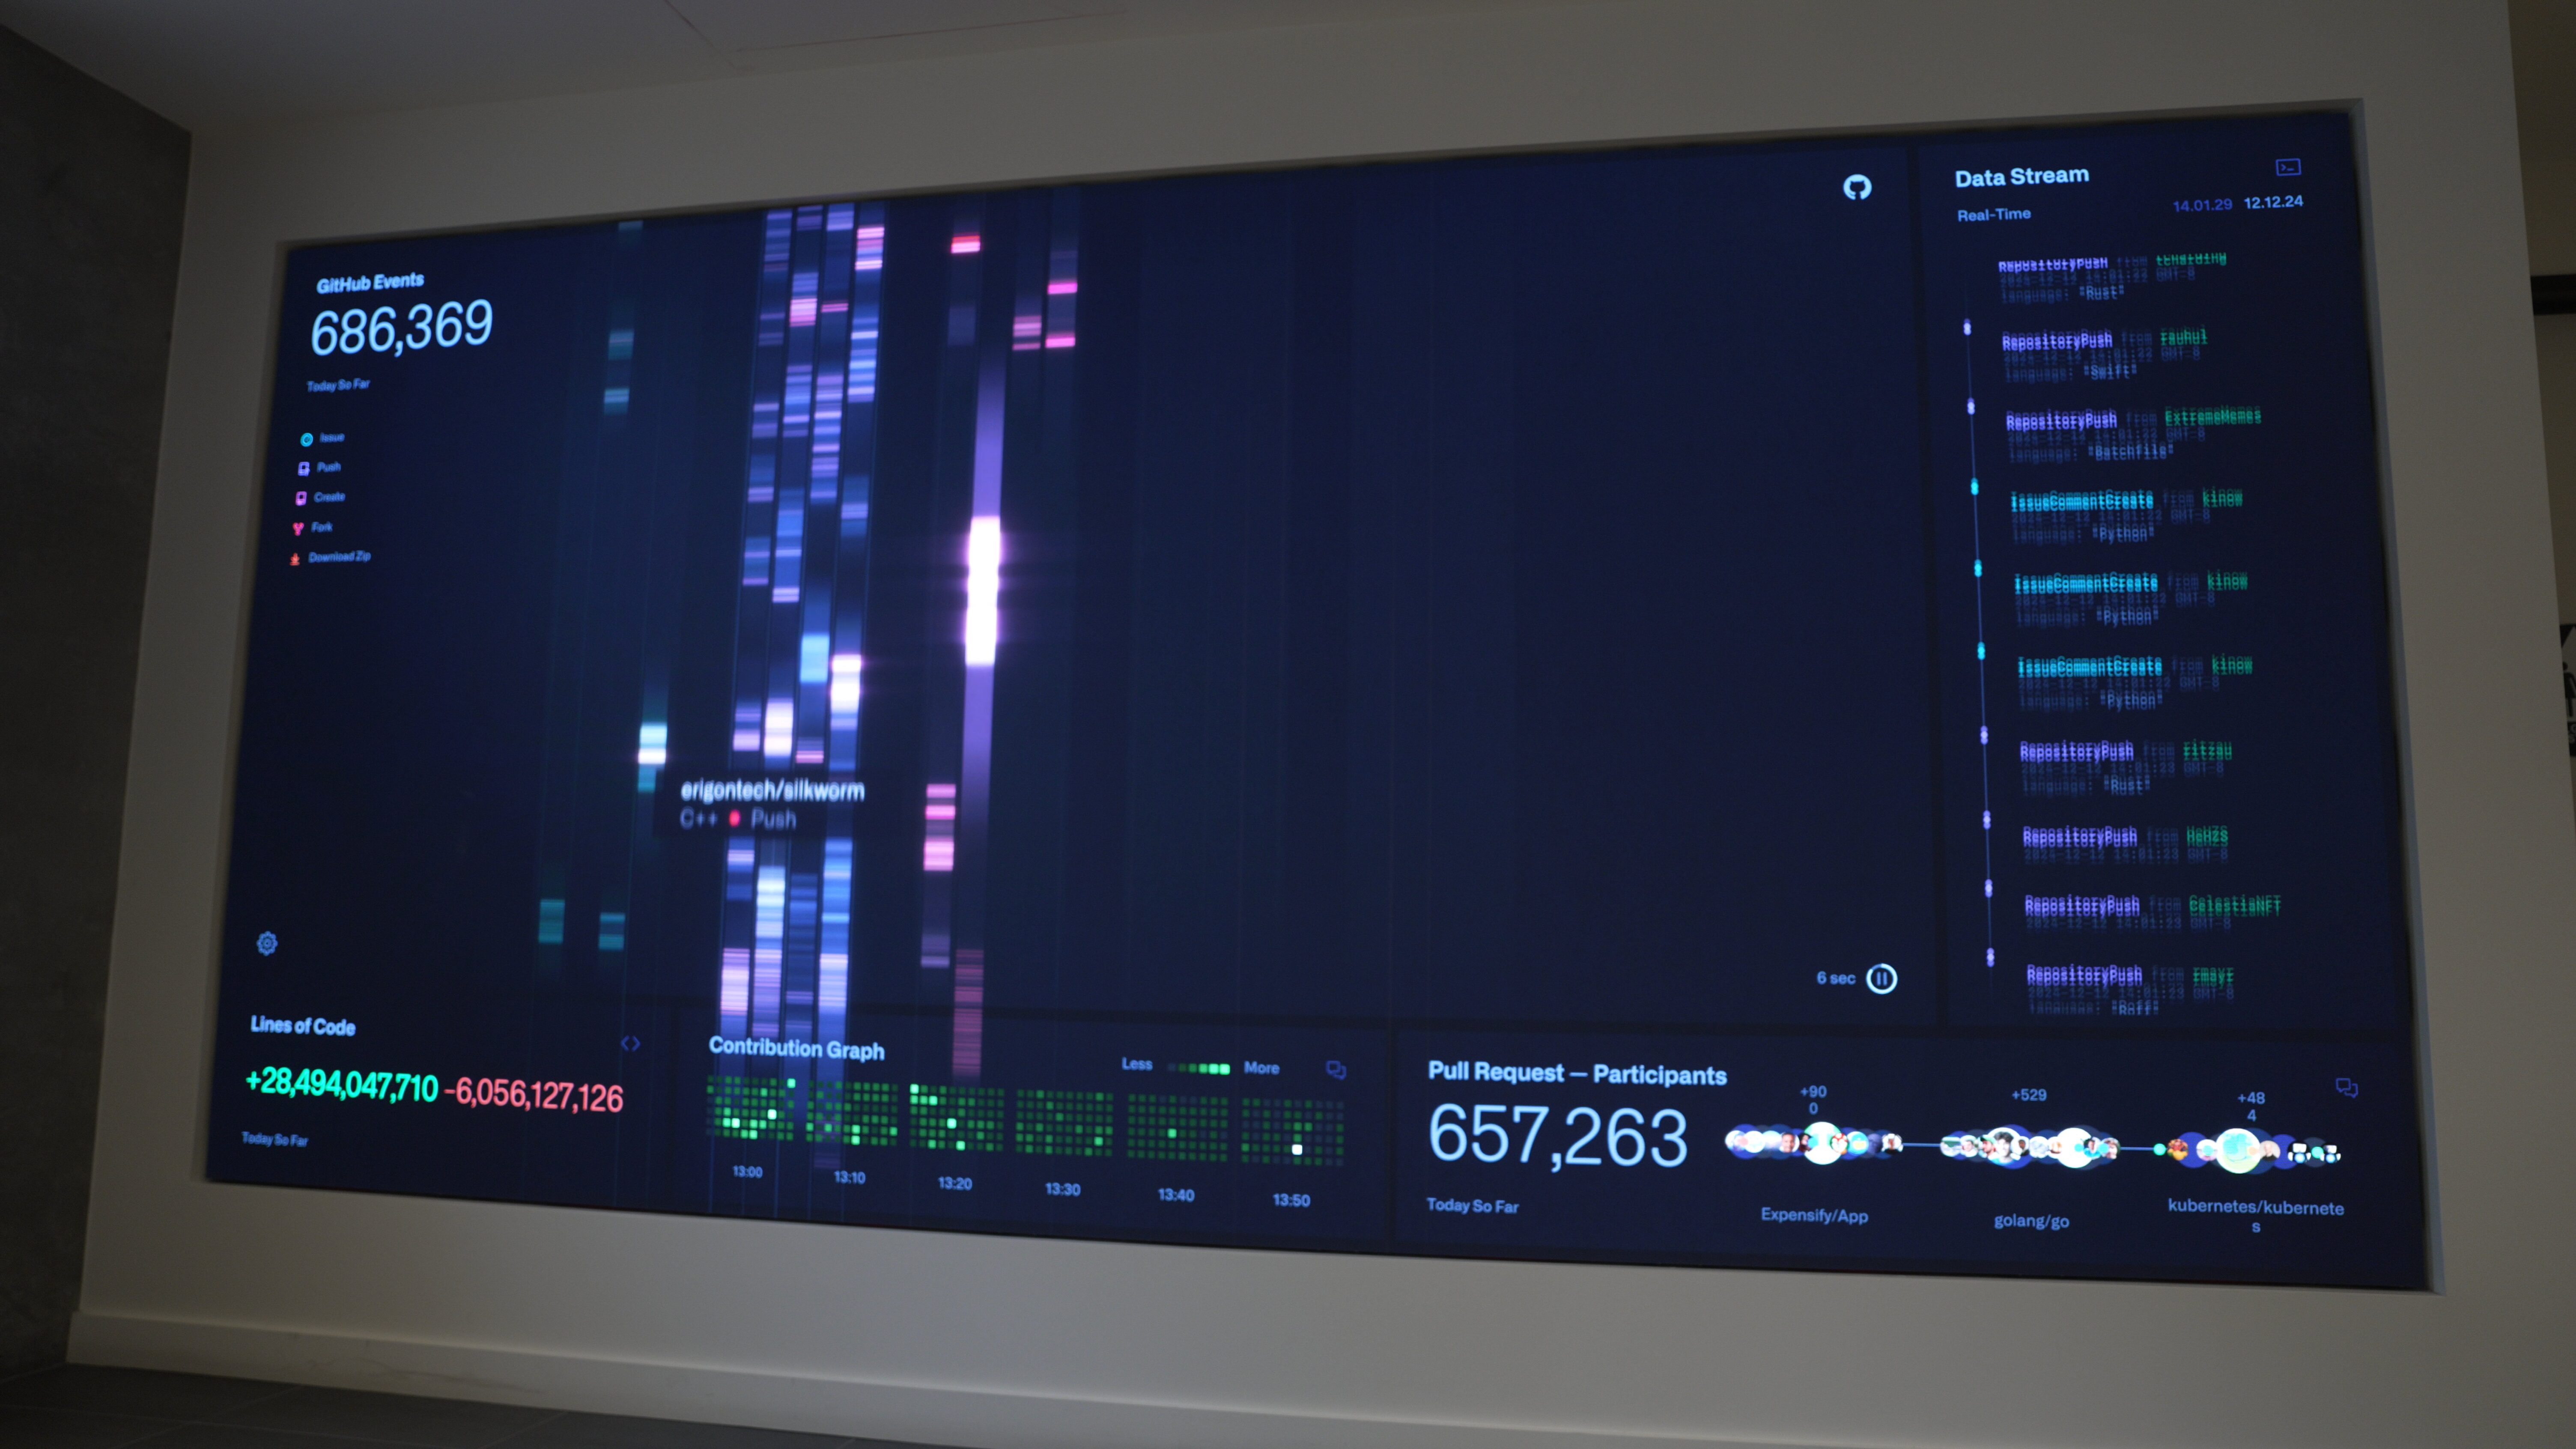
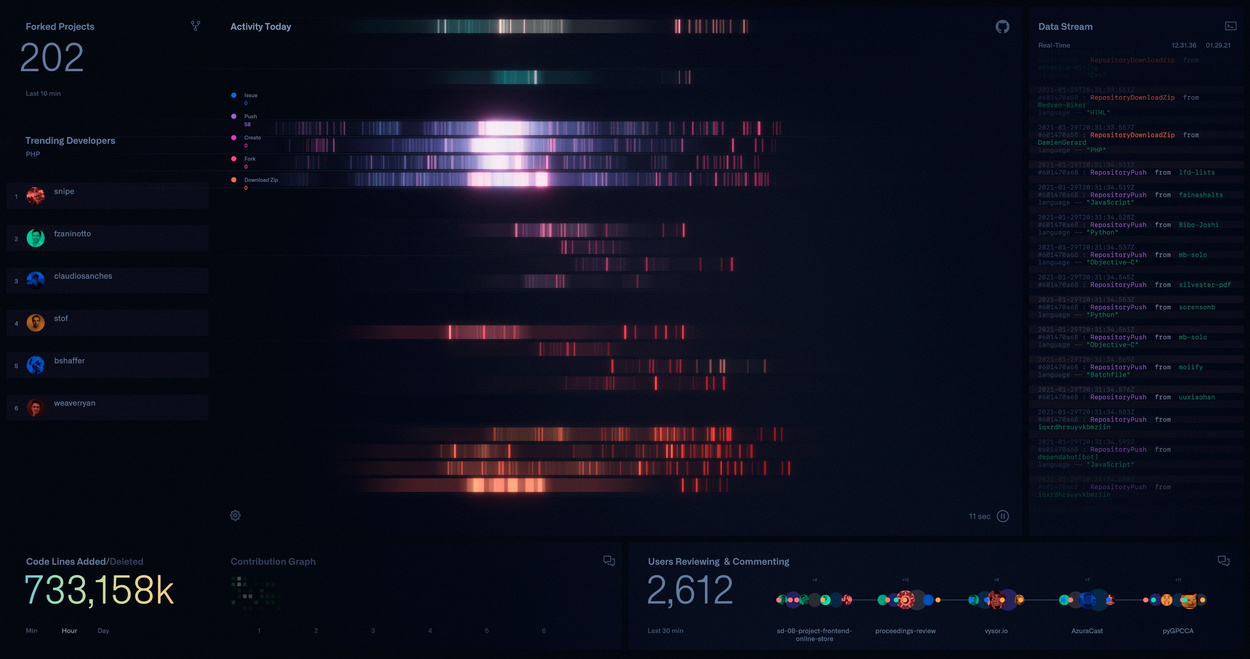
When people enter GitHub’s lobby, they were faced with our expression of their code on an epic screen. Everything pulsating and modulating together as one live information stream that instantly makes the guests feel like they’ve entered the Matrix.
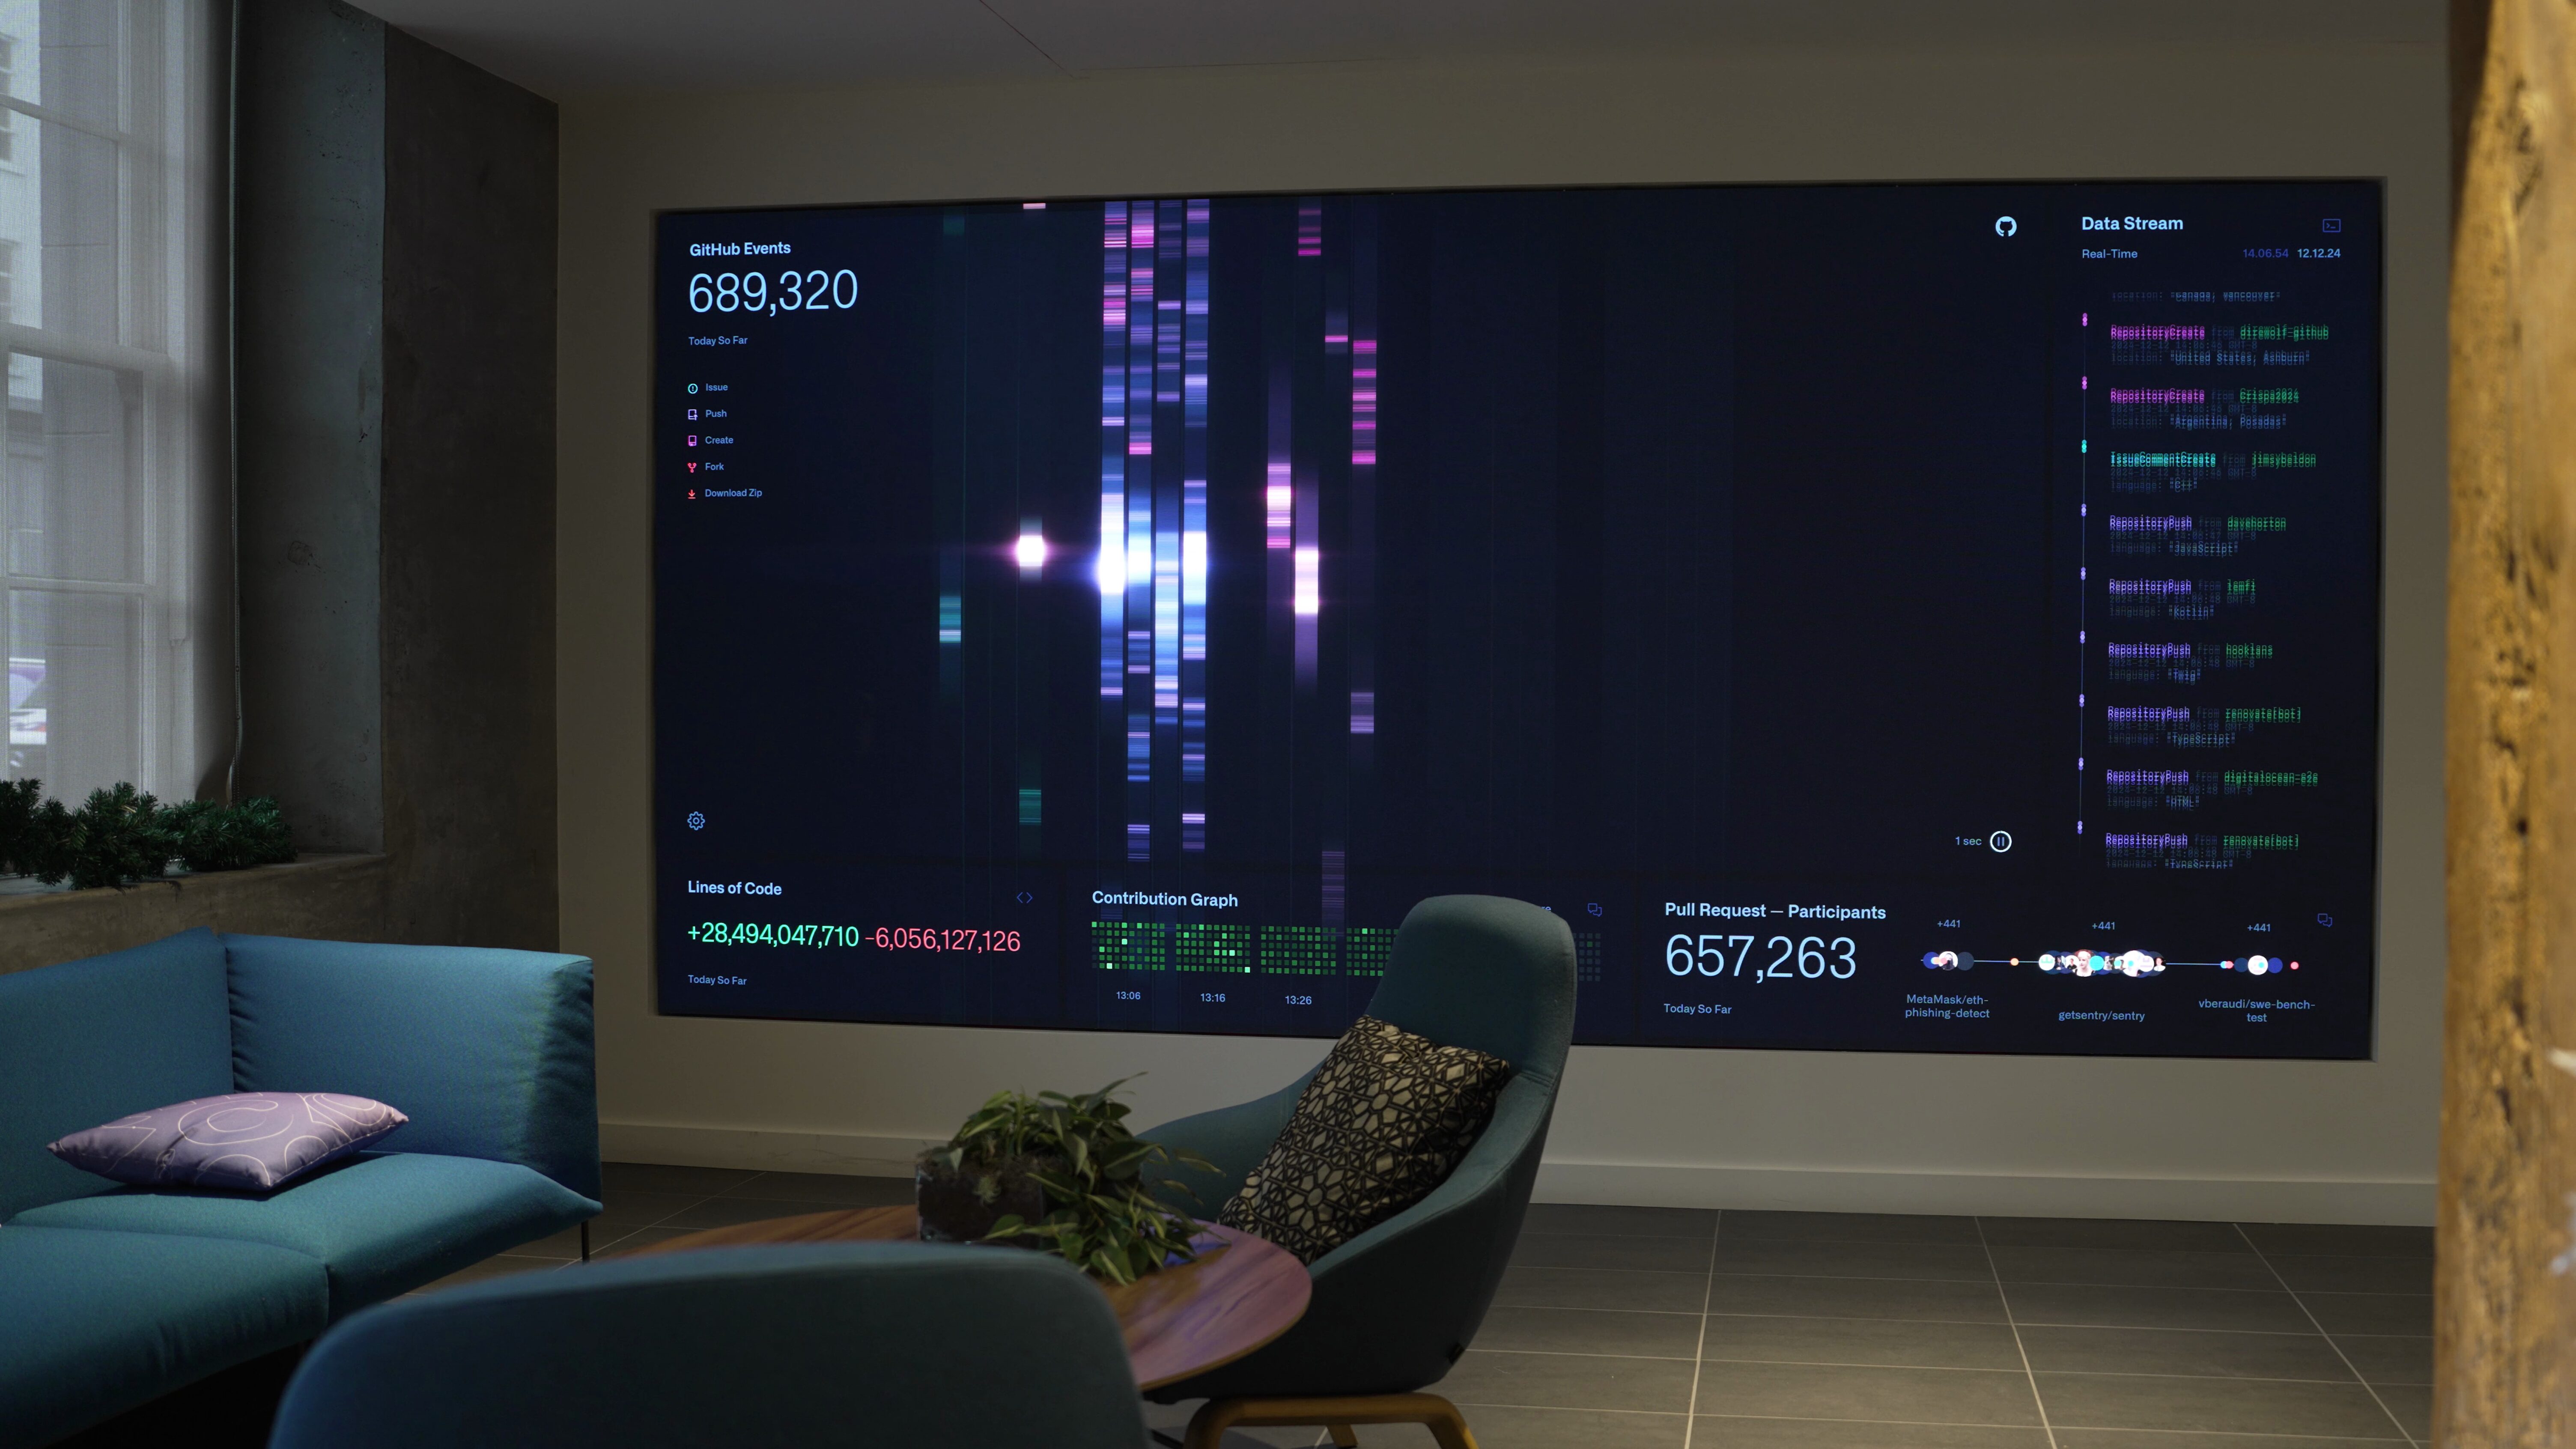
The visualizations were built on a time-based system, meaning no two moments were ever the same. The dynamic interface would change presentation layouts, update in real-time current usage and display different visualizations per a metronome measuring a constant stream of data.
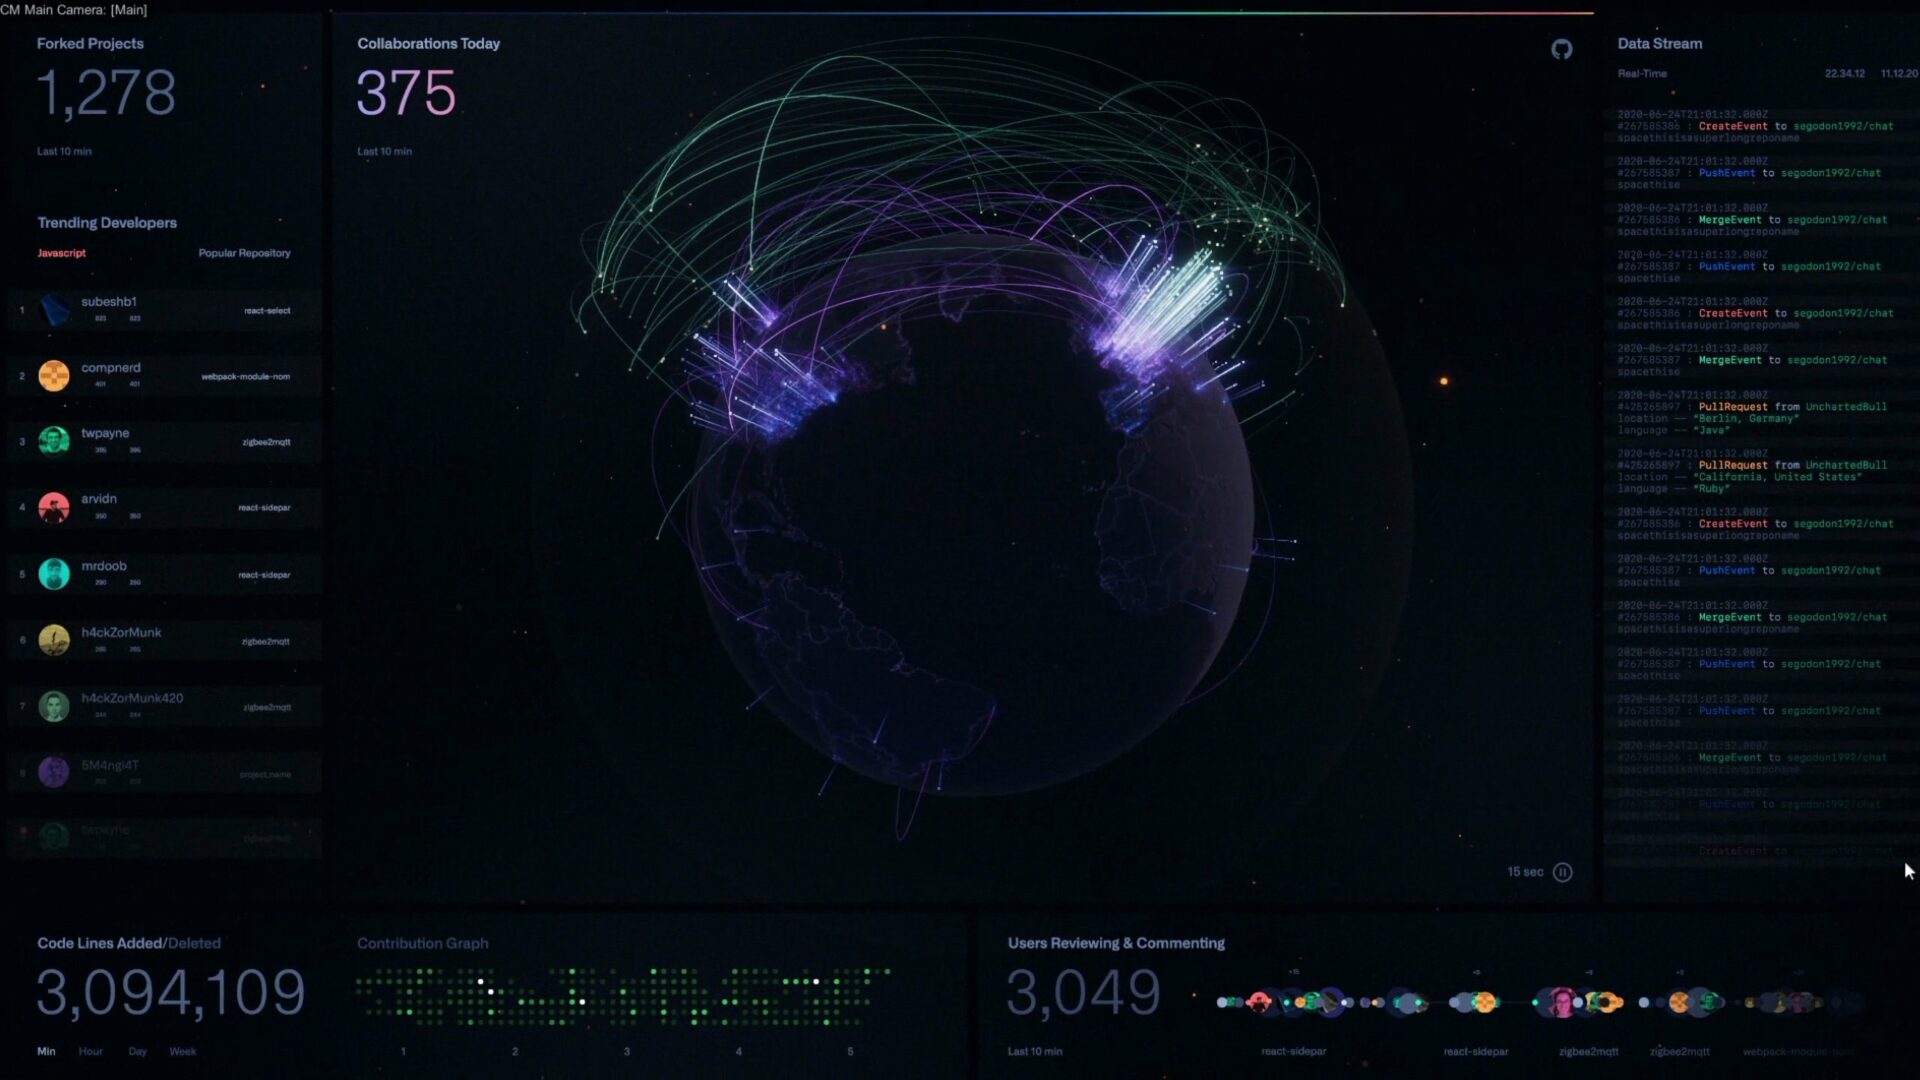
Pairing our imaginations with real data from real people, we could tell a human story about how the data lives, breathes, and propagates from individuals into systems — to ultimately bring to life the source of the science fiction future to come.
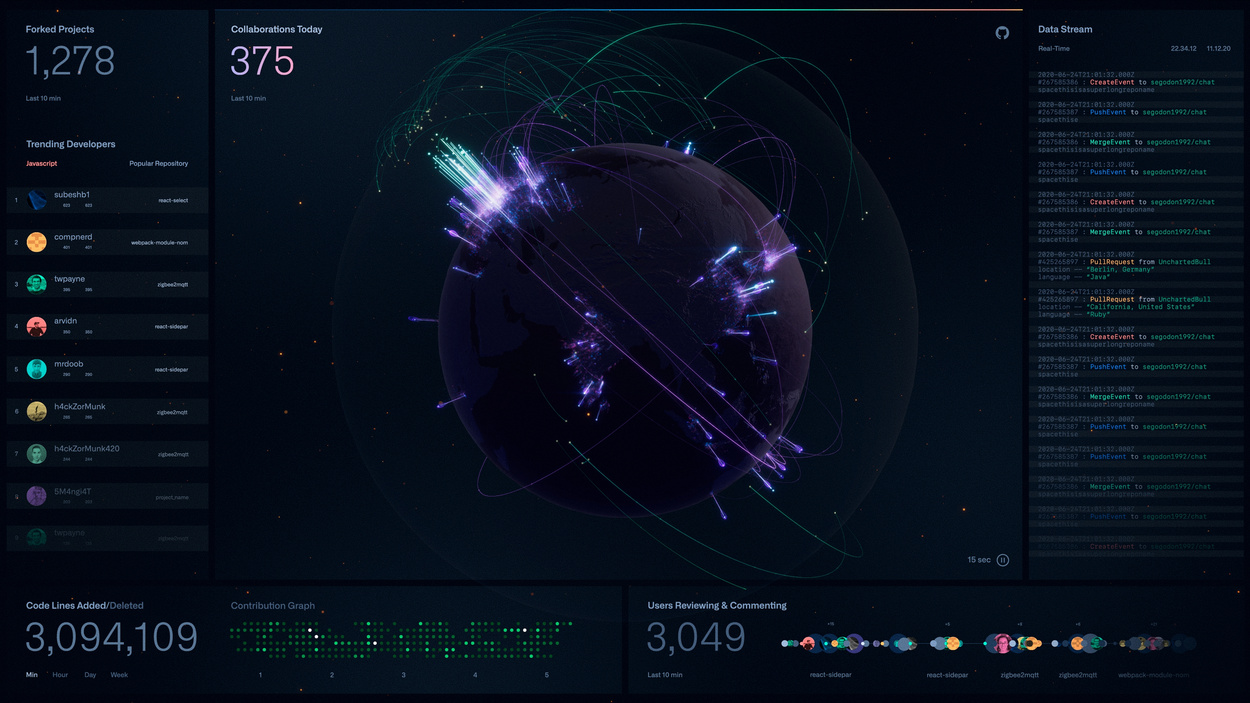
Our goal was not merely to visualize the data on a screen, but to also develop a complete interface design system in which the data could live. One that merges cinema quality graphic design with the beauty of real-time data. We wanted to express this data in a multilayered system driven by a graphic design container that houses and drives the data, constantly processing, working, and updating, as though it were a sentient being that takes in data and expresses it.
To us, the data has a soul, living and breathing with every second, essentially the embodiment of GitHub’s collective consciousness. Half grid-based graphical design, half 3D visualization, the data was designed in multiple layers that could peel back and transition into different views, depending on the parameters of the time-based information being shown. The layers represented how beneath every piece of code is a network of contributions and collaborations, always in flux.